
Trading is a challenging but rewarding endeavor when done correctly. To help them achieve this, they use technical analysis tools like candlestick patterns to make more informed decisions. One of the most popular candlestick patterns is the hammer candlestick, which traders use to spot potential trend reversals.
In this article, we'll discuss the basics of trading hammer candlestick pattern and how you can use them.
Basics Of Candlesticks
Candlestick charts represent price movements over a specific timeframe, such as a day, an hour, two hours or three hours, etc. It depends on the trader on which timeframe they would want to use to open trades. Each candlestick has four data points: the opening price, closing price, highest price, and lowest price. The body of the candlestick represents the range between the opening and closing prices, and the wicks or shadows represent the highest and lowest prices.
What Are Hammer Candlestick Patterns?
Hammer candlestick patterns have a small body and a long lower wick, with the wick at least twice the size of the body. Bullish hammer candlesticks occur when the closing price is above the opening price, while bearish hammer candlesticks occur when the opening price is above the closing price.
Let’s go through some examples!
Bullish Hammers
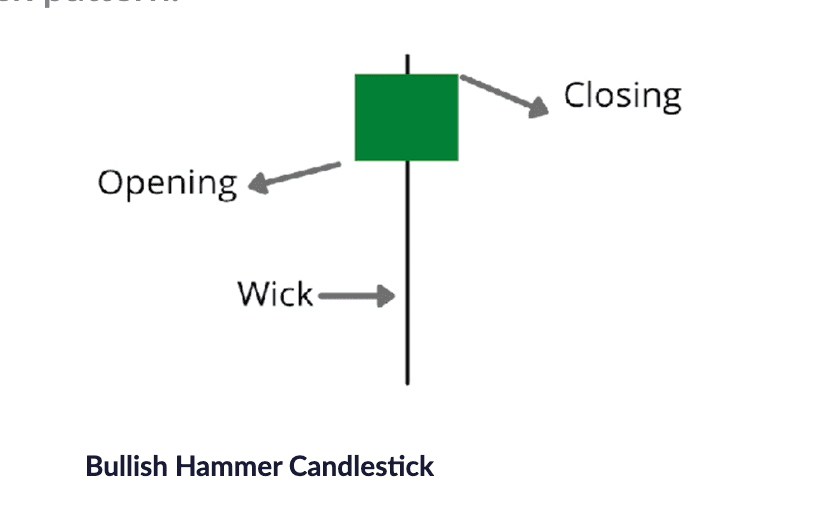
Hammer
A bullish hammer candlestick is a pattern that forms at the end of a downtrend or a correction, indicating a potential trend reversal. It has a small body with a long lower shadow and little to no upper shadow. The long lower shadow shows buyers took control and pushed the price up after the opening, while the small body indicates that buyers maintained control and prevented further selling pressure.
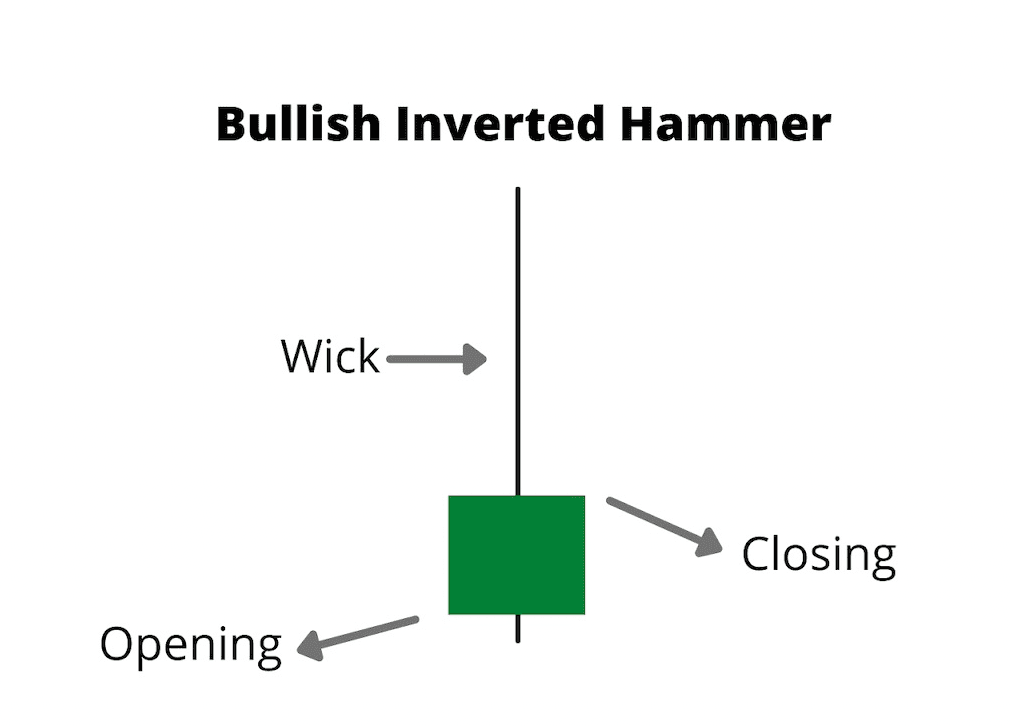
Inverted Hammer
An inverted hammer candlestick is a another pattern that forms at the end of a downtrend, indicating a potential trend reversal. It has a small body with a long upper shadow and little to no lower shadow, showing that buyers initially pushed the price up, but it was eventually dragged back down. It's a bullish reversal pattern, but not as strong as a regular hammer candle.
Bearish Hammers
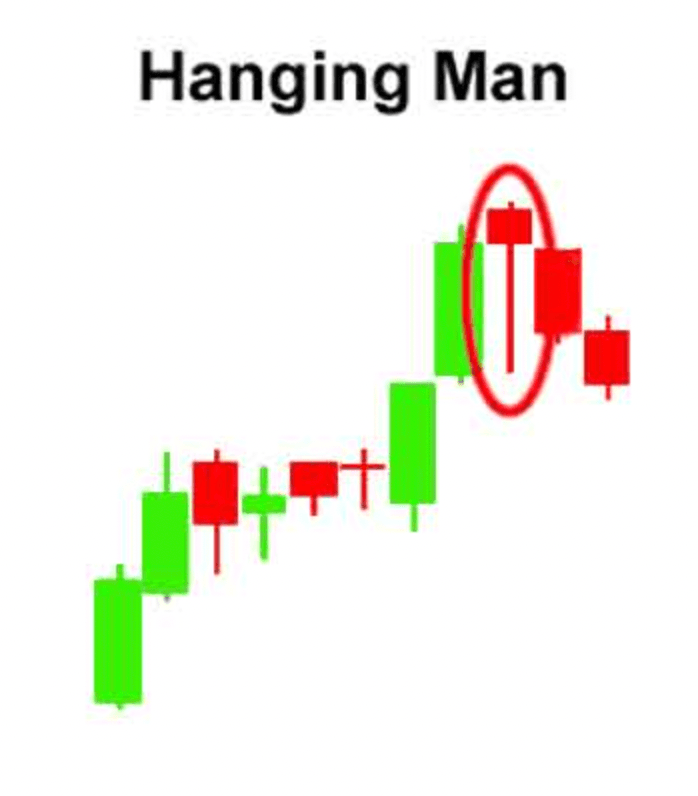
Hanging Man
The bearish hammer candlestick pattern is often referred to as a hanging man. It typically forms when the opening price is higher than the closing price, resulting in a red candle. The wick on a bearish hammer indicates that the market encountered selling pressure during the trading session, which could imply a potential reversal to the downside
Shooting Star
The bearish inverted hammer candlestick pattern is often referred to as a shooting star. While it resembles the regular inverted hammer, it signifies a possible bearish reversal rather than a bullish one. In essence, shooting star candlesticks are inverted hammers that appear at the end of an uptrend. They are created when the opening price is higher than the closing price, and the wick indicates that the upward market momentum may be running out of steam.

Pros And Cons Of Hammer Candlestick Patterns
One of the biggest advantages of hammer candlestick patterns is their versatility. They can be used in multiple timeframes and with different financial markets. Additionally, they can provide valuable insights into potential trend reversals.
However, hammer candlestick patterns are not always reliable, and they should be used with caution. It's essential to consider other factors, such as trading volume, market trends, and other technical indicators.
Candlestick vs Doji
Doji candlesticks are similar to hammer candlesticks, but they have no body. Instead, the opening and closing prices are the same. Doji candlesticks can indicate consolidation, continuation, or indecision in the market, and they can also precede bullish or bearish trends. However, they are not as reliable as hammer candlesticks when it comes to identifying trend reversals.
Hammer candlestick patterns can be powerful tools for traders looking to identify potential trend reversals. However, they should not be used in isolation and should be considered along with other technical analysis tools and indicators.
More over, traders should use proper risk management techniques, such as stop-loss orders, to minimize losses. By following these tips and tricks, traders can make more informed decisions when trading hammer candlestick patterns.
Exchange | Furo | Docs | Discord | Twitter | Telegram | Newsletter | YouTube | Github


